
Data Quality Dimensions Untangled
There are 6 data quality dimensions.
Unless there are 4.
Unless there are 15!
When it comes to data quality, people love to talk about the “dimensions” of data quality. It’s understandable if that gave you the impression that there’s some kind of actual widely-agreed-upon definition of “data quality dimensions.”
Unfortunately, there is not.
But don’t worry: in this article we’ll explore how you can make use of data quality dimensions anyway (and why there aren’t any universal ones).
What do you mean “there’s no definition”?
DAMA describes six data quality dimensions. DAMA stands for Data Management Association International, and they came up with these dimensions specifically because the situation was confusing. So if you’re going to characterize any definition as “widely-agreed-upon,” this is probably the best candidate.
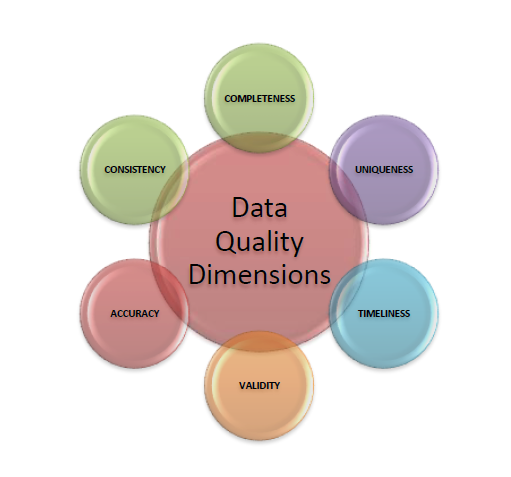 “The Six Primary Dimensions for Data Quality Assessment: Defining Data Quality Dimensions”, DAMA UK Working Group, October 2013.
And a quick google search will confirm that describing data quality in terms of 6 dimensions is very popular. But are they the same six as DAMA’s?
We’ll start with some major data quality vendors that have dedicated a page to their idea of data quality dimensions.
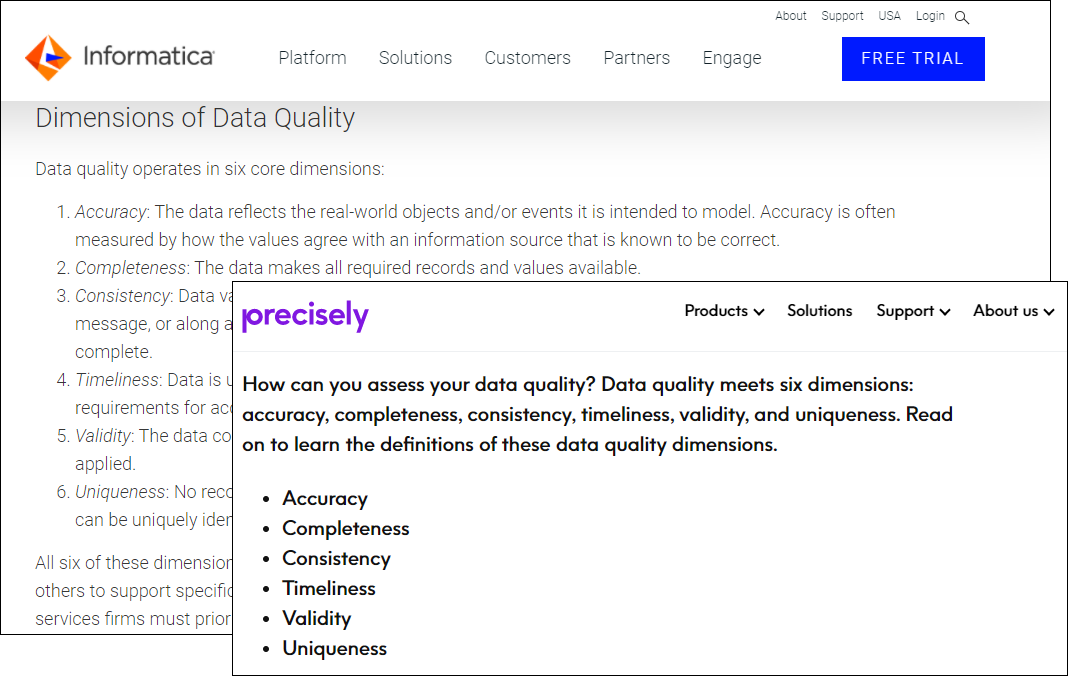
Informatica and precisely.io use exactly the same dimensions as DAMA. This is a promising start…
...and moving on to Experian and Talend, both keep DAMA’s six dimensions.
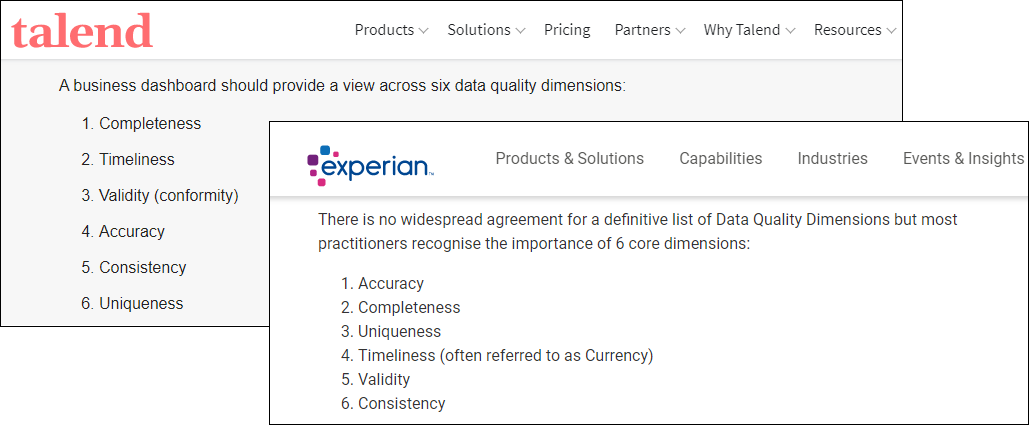
Although both of them have added different clarifying add-ons to one term. But not the same term. And these clarifying terms are also used by other sources as dimensions in their own right, with definitions different from the terms they are paired with here.
So let’s look at one more vendor, Collibra:
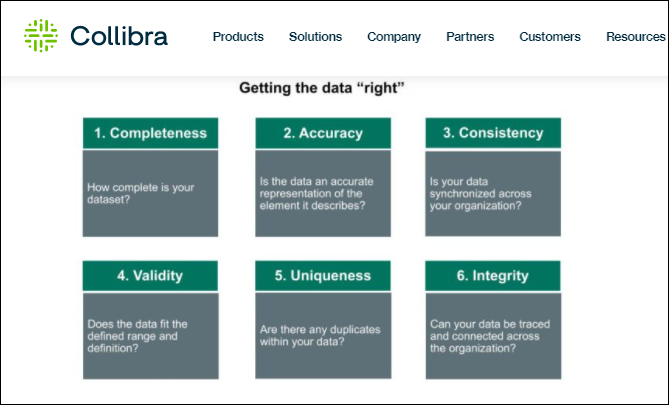
They’ve swapped out one of DAMA’s dimensions for another one entirely (integrity replacing timeliness).
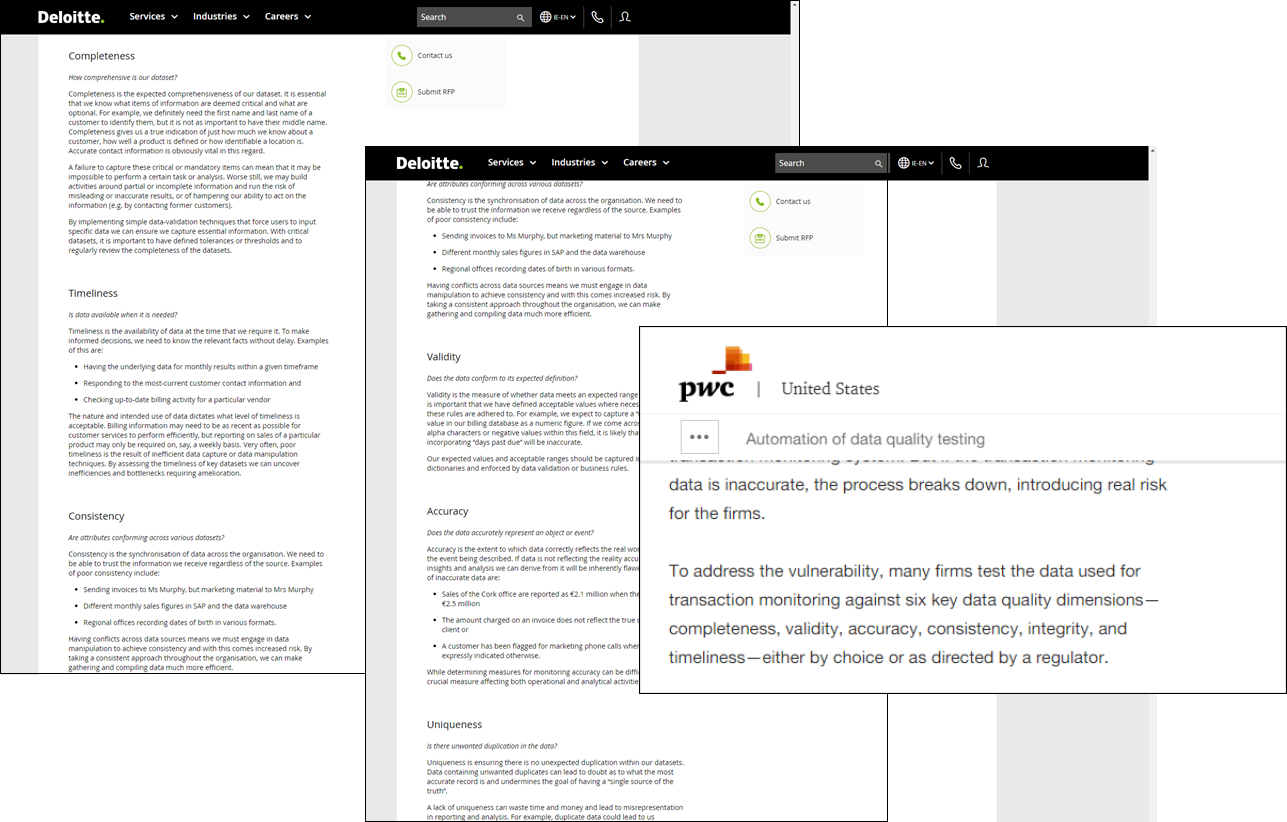
The trend continues. Consulting powerhouse Deloitte uses DAMA’s dimensions, but PriceWaterhouseCooper replaces "uniqueness" with "integrity." So you know that some companies have paid big money for those non-DAMA data quality dimensions.
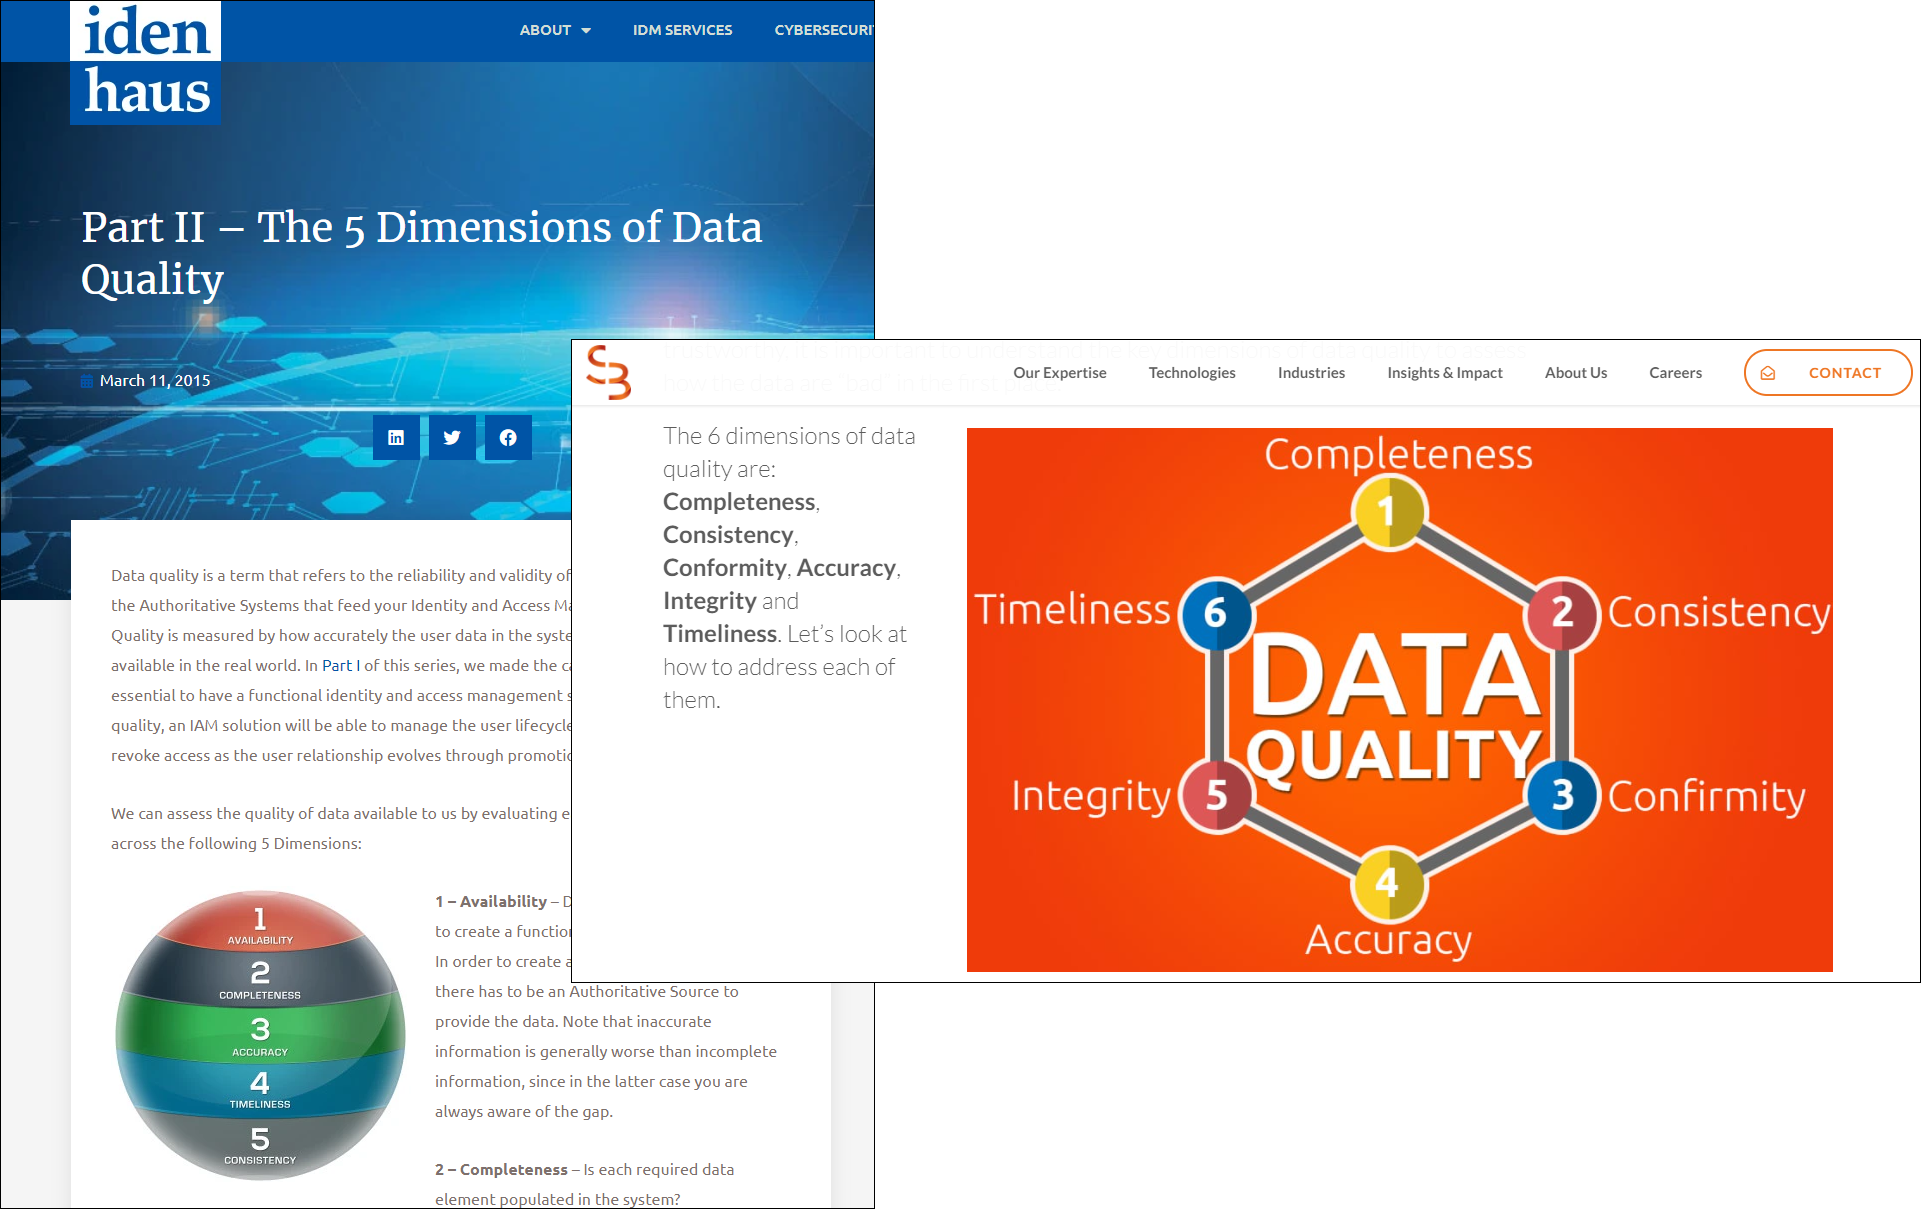
Smaller consulting firms don’t feel constrained by DAMA either. Smartbridge and Idenhaus both only have four dimensions shared with DAMA, and Idenhaus decided to go with just five dimensions overall.
But! These are all consultants and vendors. Theory doesn’t always translate to practice.
What are people actually doing?
Private corporations don’t love putting their internal documents on the internet for some reason, so we’ll look at some government entities from several countries instead.
Let’s start with the United States, where your author is based.
The US Department of Justice has 4 core data quality indicators, plus an additional 10 suggested “contextual dimensions” that may or may not be applicable to any given data.1 The Bureau of Labor Statistics, just down the road both metaphorically and literally, has 6.2 And the Department of the Interior goes big with 11.3
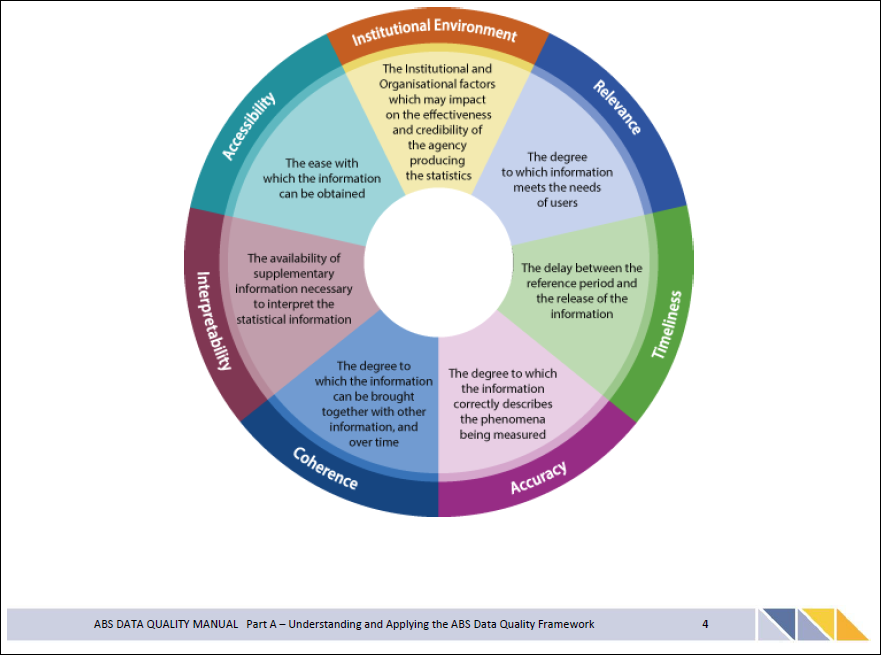
Down under, the Australian Bureau of Statistics recognizes seven data quality dimensions.4 The (Australian) state of Victoria also recognizes seven,5 but five of them are different from the ABS’s seven. The two they have in common are from DAMA.
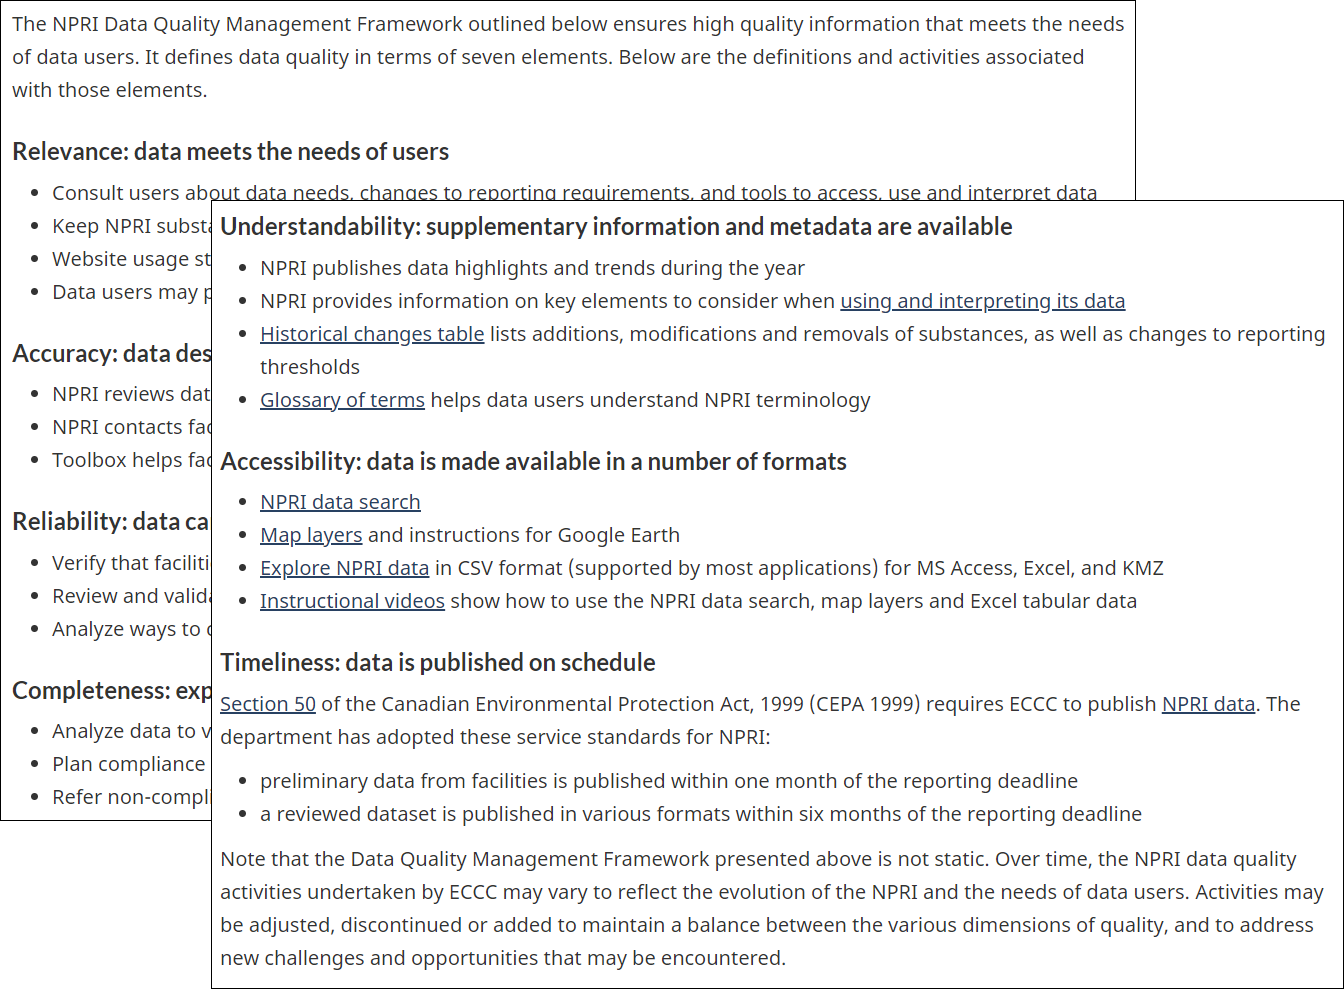
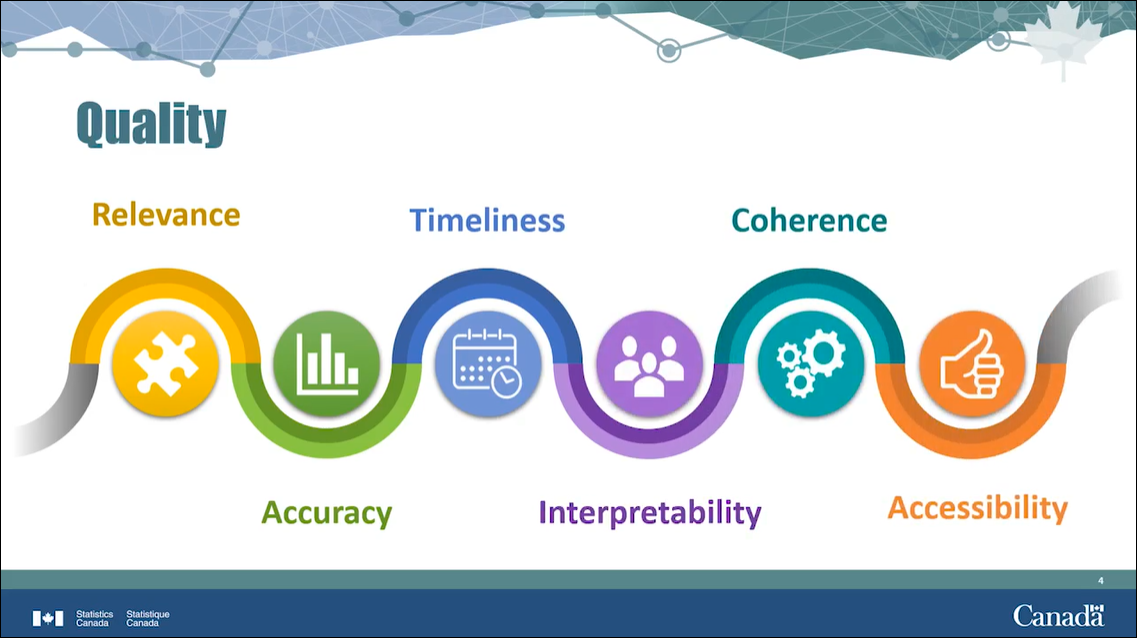
Congratulations to the government of Canada, which uses the same set of 6 dimensions in two different places.6 But the unity fails when we look at the National Pollutant Release Inventory, which has seven dimensions,7 only four of which are shared with the other set. So close yet so far.
But there is another source we can investigate: academic research. Maybe the paper-writing types have come up with something that just hasn’t caught on in practice yet?
No.
Academic understanding of data quality dimensions is all over the place, from the four “intrinsic dimensions” of Wand & Wang (1994)8 to the 16 of Pipino, Lee, & Yang (2002).9
Jayawardene, Sadiq, & Indulska seems to strike a balance at eight “main clusters”10 of dimensions, but three of those have a two-part name where both parts of the name are definitely used as separate dimensions by other people, so arguably those 8 dimensions could also be considered 11 dimensions.
What is happening here?
Here is what’s happening to cause this situation: people are making things up.
They have to. Data quality dimensions aren’t based on any concrete concepts that can be universally applied to datasets or industries. The three dimensions of physical space are real; the dimensions of data quality are not.
Data quality dimensions are, instead, incredibly malleable concepts that your average marketer/manager/researcher can hammer into any form they want.
Problems arise when you try to treat data quality dimensions as something more than what they are. They’re a flexible tool that’s useful for thinking about and representing data quality on several fronts; they’re not some fundamental property of the data.
You need to know why and how you’re using data quality dimensions. You can’t just grab a list off the internet and go.
Why use dimensions if they aren’t real?
Here are the three main reasons to use data quality dimensions:
- They sound cool.
- They’re a useful framing device.
- They help you aggregate results.
We will now discuss each of these.
Dimensions make you sound cool

“Sounding cool” is a legitimate use for data quality dimensions. You could also describe it as “internal marketing,” if you want to be formal about it.
If you’re working on data quality, you’re probably convinced of its value. You also understand what it is: the types of problems that your data has, down to specific examples, what it affects, why it matters.
A lot of people in your organization don’t know about it and don’t care. Unfortunately, you probably need their help in one way or another:
- Maybe they’re a subject matter expert and you need them to carve out time to talk to you about what business rules to create.
- Maybe they’re another manager and you need their buy-in to change one of their department’s processes.
- Maybe they’re a VP and you need them to sign off on giving you a bunch of money.
- Maybe they’re the CIO and you need them to sign off on you continuing to have a job.
Which of these is better:
Option A: You explain data quality to them. You give several examples of bad data quality and how it has affected the organization. You describe the cumulative impacts of the bad data quality you have had. There are so many words.
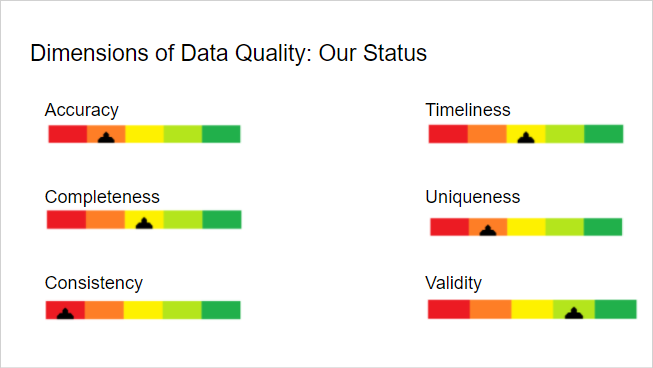
Option B: You present them a graphic with the meaningful-sounding title of “Dimensions of Data Quality.” It has beautiful yet alarming gauges for each dimension showing how your company is falling short and only giving you time/buy-in/cash/employment can save it. Each dimension is a single word that the vast majority of viewers will have a mental image for already.
Of course, this is a trick question, and the answer is “both together.” Assuming you can get your audience to pay attention to you.
But that’s a big assumption.
If you’re trying to get through to someone who is on their phone through the entire meeting, or who won’t read an email with more than one sentence, you want dimensions.
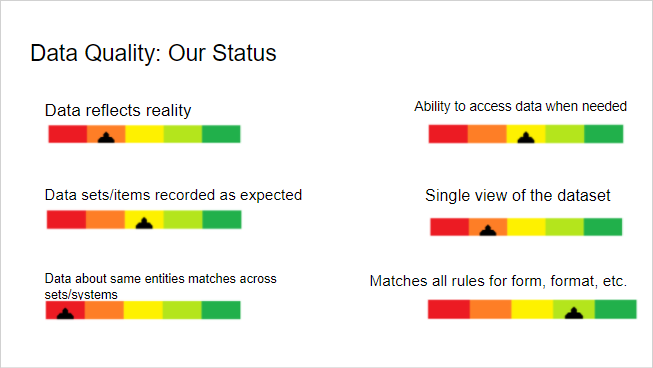
Looking at these, you might be thinking: the dimensions are exactly the same as your non-dimensional examples but phrased more succinctly.
Yes. Exactly. You’re using data quality dimensions as a marketing tool, to build understanding of and support for data quality and your projects within the company.
Dimensions are a framing device
Data quality can be complex even for relatively simple datasets. With complex data, there’s a lot to keep track of.

Data quality dimensions help you divide everything into more manageable pieces, so you can deeply consider different angles without losing track of everything else.
The dimensions that will be most important to you depend on, well, you—what you’re using the data for, what your challenges are, and how you conceptualize everything.
Surely, you might say, there’s at least ONE dimension that everyone can agree is standard. Like accuracy.
This is almost right, but is not. Some sources, for instance, frame "accuracy" as "correctness." Which maybe you could brush off as a purely semantic difference.
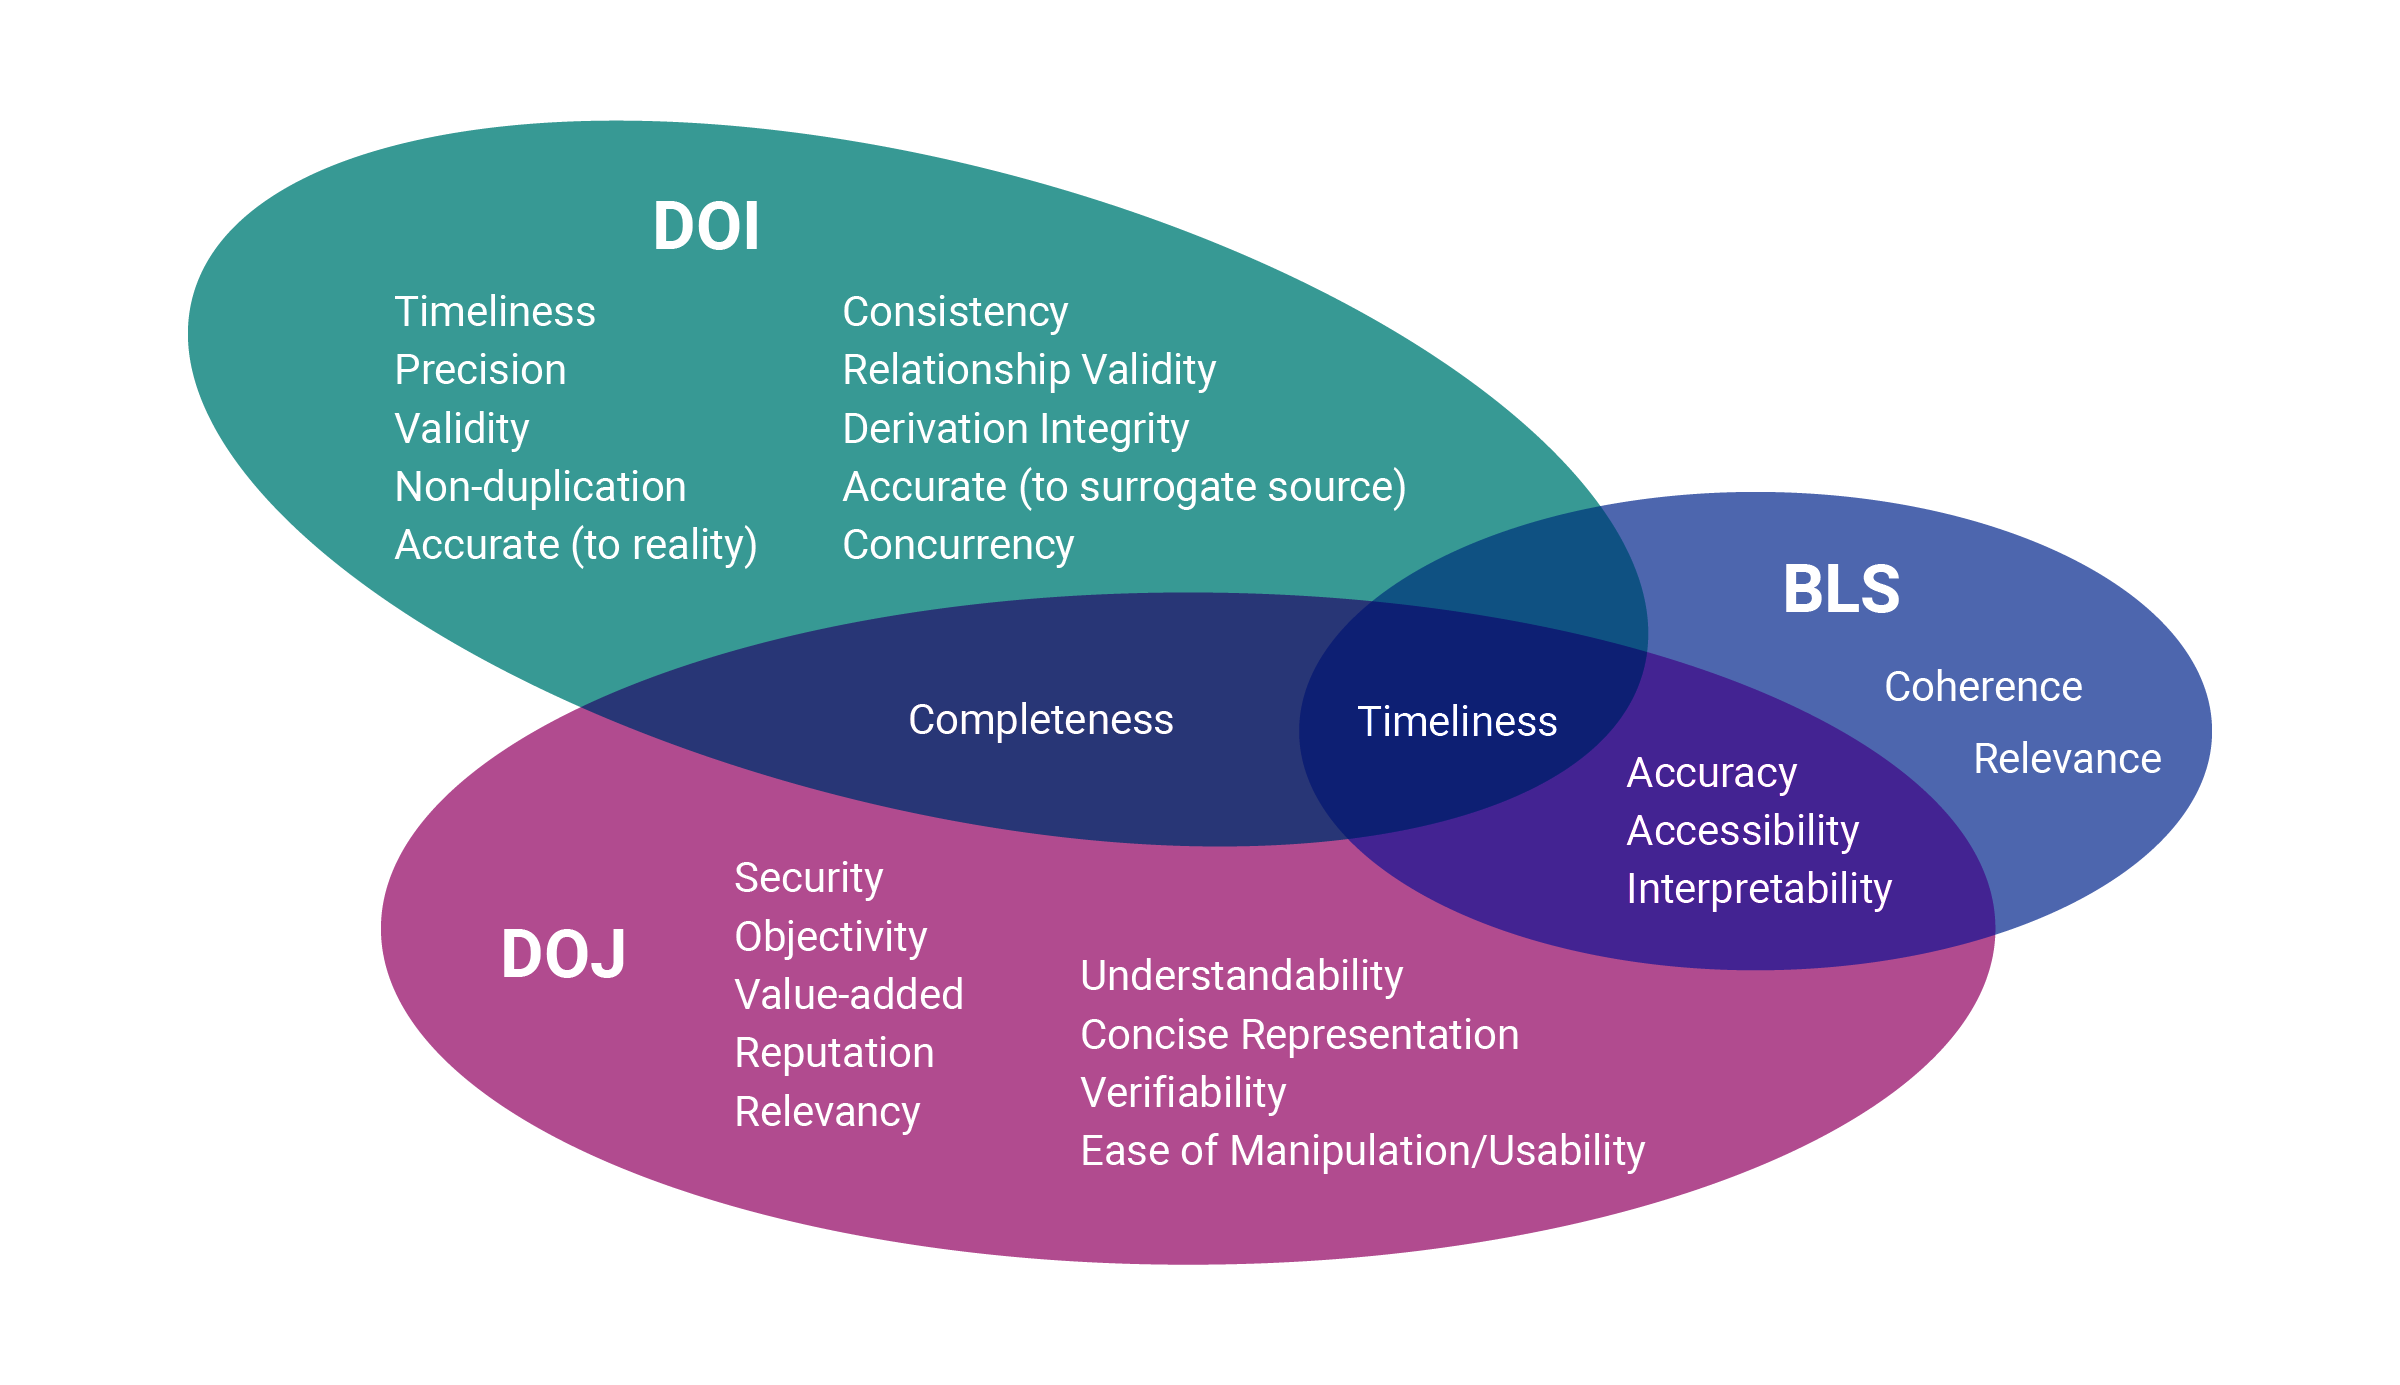
But for the counterexample we will turn to the Data Quality Management Guide of the US DOI. The one with 11 dimensions.
Two of those dimensions are "Accurate to reality" and "Accurate to surrogate source."
OK. Given that, what did we mean by "accuracy" (or "correctness") before? Probably you were imagining "Accurate to reality."
But the DOI also considers “The degree to which the data match the original source of the data, such as a form, application, or other document.” The given example of data that is not "Accurate to surrogate source" is “An applicant’s income reported on the application form does not match what is in the database.”
Surely that could be "consistency," you say.
It could be. But for the DOI it isn’t! Consistency to the DOI is about whether the data matches within the DOI’s own databases.
It’s easy enough to imagine a scenario where data that’s consistent to the DOI fails one or both accuracy dimensions.
Imagine that the DOI has your income from last year as the same number in all its databases: it’s consistent.
But now you have a new job that pays more, so you write that on this year’s form. The database is now not accurate with regard to the surrogate source—your form.
But you leave out your under-the-table earnings from filling in at the restaurant on weekends. Now the database is not accurate with regard to the surrogate source or with regard to reality.
With one form field, you’ve made the DOI’s database inaccurate in two distinct ways.
Imagine being a DOI data quality manager and trying to define Accuracy in a way that encompasses both "Accurate to reality" and "Accurate to surrogate source."
Your rules measuring accuracy would sometimes be measuring against one thing (reality) and sometimes another (surrogate source). In conversation, you’d have to constantly clarify what you’re talking about. An overall accuracy score wouldn’t be enough information to give you even a rough idea of what might be wrong.
Choosing to define two different data quality dimensions instead of a blanket accuracy alleviates all of those problems.
Dimensions are a good way to aggregate your results
This last way of using dimension is a pretty simple extension of the “sounding cool” and “framing device” uses, but looking at it specifically completes the picture of how data quality dimensions can be useful throughout the DQ process.
Once you’ve used dimensions as a framing device to identify what’s important, what issues you’re facing, and all that other fun stuff, you can start developing the measurements and rules you’ll need to actually determine your position relative to those metrics. And then you need to execute those rules and make those measurements.
And finally, at some point, you’ll have to 1) look at your results and 2) show them to other people.
You aren’t going to want to look at every individual rule’s results, every time. That way lies madness and/or a sprain of your scrolling finger. You need to aggregate results.
But how to aggregate? You definitely want to aggregate the results in the same groups, with the same weightings, every time. Then your aggregations are comparable over time.
You also want the aggregations to be groups of rules that are related in some way, not just random collections. Then you can use the aggregate score to illustrate a meaningful concept.
How can you define these groups for aggregations?
That’s right: dimensions!
If you’ve already established dimensions as a framing device, half the hard work is already done. (The other half is deciding how exactly to calculate the aggregated result: do you weight any results and things like that.)
In this context, dimensions are a way to aggregate your results into top-level results that are easier to understand and present.
Why use “dimensions” instead of just doing these things?
A good chunk of data quality problems are caused by fragmentation. Datasets are spread across systems, institutional knowledge is siloed, users from different systems don’t communicate with each other and don’t understand each others’ needs.
You need to watch out for the same problems happening within your data quality team. The manager, doing outward-facing internal sales to other teams in the company, the analysts working with other teams to identify their needs for the data, figure out what problems are, and what rules are needed, and the data engineers implementing those rules and calculating results all need to stay on the same page.
If you’re all working from the same dimensions as you sound cool, frame the issue, and aggregate results, you’ll help alleviate data quality issues within your own team.
(And if you’re a DQ team of one, all of the above still applies as you switch between mindsets.)
If dimensions are so flexible, how do I know what to do?
Don’t worry: because data quality dimensions are so malleable, you have a lot of room to figure out a combination that you can define in a meaningful way for your situation.
To begin, choose your path:
- Pick 😕 if
- You are stressed and overwhelmed by this
and/or - You do not have a firm grasp of your data quality situation yet.
- Pick 😀 if
- You’re excited to explore your options
and/or - You have a strong understanding of the data quality picture you’re responsible for.
Remember, you can also change your mind as you figure out what works and what doesn’t. The dimensions you decide to measure starting out aren’t a commitment that you’re stuck with: they’re a starting point.
At any point in this process—and even much later on in your data quality journey—as you become more comfortable with data quality dimensions and better able to measure different aspects of your data quality, you can add or remove dimensions as needed to provide you with the most value.
😕 If you are stressed, overwhelmed, or aren’t sure what’s going on yet...
Start with DAMA’s dimensions. Vendors, consultants, and your fellow data management professionals won’t bat an eye if you say that’s what you’re working from. And they’re broad enough to encompass a lot of issues, so you probably won’t run into something it’s impossible to categorize right away (especially if you’re using the trailblazer approach).
For more information about DAMA’s definition, reference one of their whitepapers, like this one. Or grab a copy of their book, the Data Management Body of Knowledge (or DMBOK); data quality is covered in chapter 13 in the latest version as of this writing.
😀 If you’re excited to explore your options, or have a good idea of your DQ challenges...
Good news: a 2020 research paper surveyed a selection of reliable sources and found 127 different dimensions.11 So you have a lot of room to work here.
Please do not try to start by measuring 127 different dimensions.
Instead, look at this word cloud:
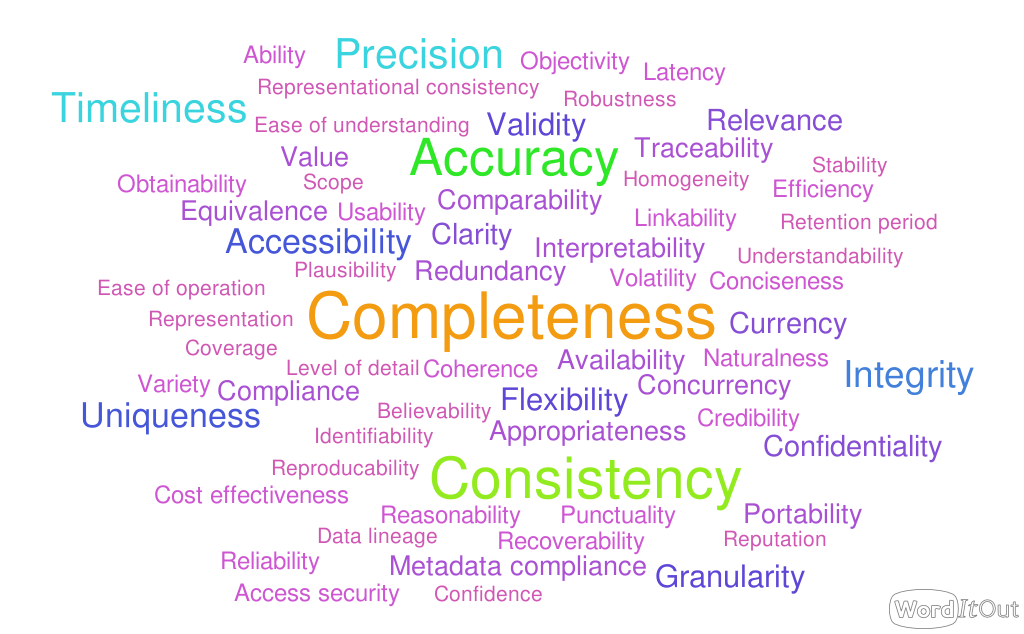
Think about your data quality problems, then select 4-10 dimensions that initially resonate with you regarding those.
At least one of them should be “Accuracy” or “Correctness” or something along those lines; if it’s not there, people will have questions. You do not want the CIO glancing up from their phone just long enough to not see one of those words on the results slide.
This is your starting set of dimensions.
I have dimensions, now what?
Then, consider each of your dimensions in turn in conjunction with your specific project needs. This will help you define what each of the dimensions needs to mean to you.
Ask questions like:
- What or who is the data about?
- Do we expect the data to change over time?
- Do we expect records to be unique?
- Who is using the data?
- What is important to those people?
- How up-to-date do they need the data to be?
- What historical timespan are they using data from?
- Do they need every last record or is a representative sample OK?
- Do they need individual records to be completely filled out, or are partial records OK?
- Does the data expire?
- How many systems does the data come from?
- Is it possible for the entities described in the data to have records in more than one system?
- Who puts the data into the systems?
- Who gets the data out of the systems?
- Is all historical data retained, and if not, what is the deletion policy?
Here are a few different example scenarios.

The data is comments that have been left on your social media pages by users. You do not expect it to change over time; once a comment has been left, it is static, so a duplicate record would indicate a technical malfunction.
You expect records to be unique, since each record represents one comment being posted by one user. The data is being used by a data analyst performing sentiment analysis on the comments to determine overall reactions to your brand.

The data is reports from your company’s “drive and save” car tracking devices. You expect data about individual drives to change a lot, data about individual users to change less frequently, and data about the vehicle to never change.
You expect records to be unique, since each record is from a single moment in time for a single vehicle; a duplicate would indicate a technical malfunction. The data is being used by data scientists who are creating statistical models relating driving behavior to expected outcomes in different scenarios.

The data is customer records from your company’s Valued Customer membership program. You expect the data to change somewhat over time as users update their personal information by moving, getting new phone numbers, changing their name, etc.
You expect records to be unique, since each record represents an individual person; duplicate records could come from any number of sources, including technical malfunctions, human errors on the customer’s part, human errors on your company’s part, failed data integrations, and more. The data is being used to segment customers and send them the marketing materials and rewards offers that they are eligible for.
How do I combine these thoughts with dimensions?
Here are some examples of how these different scenarios would prompt different approaches to a couple of different dimensions.
Timeliness

Let’s consider timeliness as a measure of how quickly the data can be obtained at the time that it is wanted.12
In scenario 3 (membership records), timeliness at the individual record level is very important: if a member calls customer service right after updating her information from Amira Kingston to Amira Yang, you don’t want the representative to ask “Ms Kingston” what they can do for her. The acceptable gap between when data is created and when it is available is very short.
In scenario 2 (vehicle tracking), timeliness is less important. Since the statistical models use a lot of historical data, and their results aren’t used in dynamic on-the-spot ways like customer data is, the acceptable gap between when data is created and when it’s available can be pretty long: a week or more would be reasonable.
In scenario 1 (social media comments), timeliness is somewhat important. The data isn’t used as individual records, but let’s say the analysts want to understand real-time responses to new announcements. This might mean the acceptable gap between data creation and availability is something like 2 hours. On the other hand, if they aren’t doing real-time tracking, it could be days or weeks. It might be different at some times of year than others—you’ll have to talk to the analysts to find out!
Completeness

Let’s initially consider completeness as a measure of how many possible fields of a record are filled out.
For membership records (scenario 3), completeness is very important. Customers are segmented based on everything from their birthday to the shirt color they buy most often. Special offers are associated with birthdays and signup anniversaries. Communications address the customer by first and last name at different times. Special pricing is often confined to residents of a certain area.
If a member record is missing data, that’s subpar; but, you probably can’t force members to provide all the information you’d like. That makes 100% completeness for each record an unrealistic goal for the immediate future, and possibly forever. Figuring out what’s obtainable will be part of your wider data quality process.
In this scenario, you might want to additionally measure the completeness of only a subset of fields—the most important ones. Then you can understand the completeness of data you must know about a person versus the completeness of data you’d like to know.
For social media comments (scenario 1), you’d expect very high completeness: whatever data the platform makes available, you expect to get for every record. But different social media platforms make different amounts of data available; perhaps it makes sense to measure completeness only relative to the shared fields that you actually use.
This is the equivalent of measuring only the “must know” completeness in the previous scenario and not measuring the “like to know” at all.
The final scenario for completeness is vehicle tracking (scenario 2). In an ideal world, you’d expect records from your own devices to be 100% complete 100% of the time.
But this isn’t that world: devices can break, or users can fail to use them correctly, causing full or partial data loss. What level of that is typical? That’s something that ongoing completeness monitoring can answer.
You can then position that against the paired question of: What level of incompleteness is acceptable? This is something only your data scientists can answer, and it might differ by person or by project.
By measuring completeness in this way, you can draw a direct line between data quality and the reliability of your data scientists’ conclusions.
If the typical level of completeness is lower than the acceptable level of completeness as specified by data scientists, that creates a strong case for hardware improvement. Either the devices need to break less, or they need to be modified to increase user success.
Completeness (alternate)

We can also consider completeness as a measure of how many of the records that exist are obtainable.
For membership records, this kind of completeness is also very important. You need membership records from the CRM that was just retired or the database of the company that you just bought out just as much as you need records created in your brand new CRM. You absolutely do not want a CSR to have to tell a caller that they can’t be found in the system.
For social media comments, this kind of completeness is more important than the record-level completeness… but if one is missing here or there, it’s not necessarily a huge deal.
A technical hitch with one platform’s API could be a minor issue or a big deal, depending on the volume of records affected. You’ll need to talk to your analysts to see what they consider to be a representative sample and figure out what’s acceptable and what isn’t.
For vehicle tracking, your data is coming from your own devices. So in general, you’d expect that your own data scientists would be able to get any data they want, easily.
With this definition of completeness, you’d be measuring if that’s true or not. Where does the data go from the devices? Can data scientists pull data directly, or do they need to go through an intermediary?
Can the data scientists get a representative sample they are happy with, or are they restricted to queries that are too simplistic? Is the data kept for as long as the data scientists need it, or is it deleted? Or is it archived somewhere hard to reach?
Why did you just propose two different definitions of completeness?
This is what I meant about the dimensions being malleable.
If you are in a scenario 3 position, it probably makes more sense to measure the two versions of completeness separately: as Record completeness and Dataset completeness, or Completeness and Availability.
This is because there are a lot of factors that can affect both forms of completeness, so each is relatively complex in and of itself.
If you’re working with scenario 2, you expect both forms of completeness to be very high.
But you probably have fewer complicating factors than in scenario 3; data isn’t entered by hand, for instance. So you might choose to use the two-dimension strategy, or you might measure both in a single dimension.
In scenario 1, you might want to start out measuring just one of these. Perhaps the analysts have a good experiential sense that the Record completeness situation is acceptable, and the pressing issues are with Dataset completeness.
You could choose specifically Dataset completeness as your dimensions, or simply choose to define “Completeness” as having the Dataset completeness meaning. Eventually, once you have a robust program for the pressing problems, you could want to add a dimension that measures the Record completeness sense to monitor for future issues.
CONCLUSION/TL;DR
Despite people throughout the data quality community talking about “data quality dimensions,” there’s no universally-agreed-upon idea of what these dimensions might be.
The set of dimensions proposed by DAMA is probably the closest you’ll get, and there are major vendors, consultants, and organizations that don’t conform to DAMA.
But that isn’t to say that “dimensions of data quality,” as a concept, aren’t useful. They are—but they’re a much more flexible, malleable idea than they’re usually presented as.
Data quality dimensions are useful tools for:
- Internal marketing
- Framing data quality problems
- Creating aggregate results.
You don’t technically need data quality dimensions to do any of these things. But by using the construct of the “data quality dimension” to formalize the interconnection of these activities, you can unify the data quality team around dimensions and help avoid some of the fragmentation that causes data quality problems.
It’s important to recognize that because data quality requirements can vary so widely between projects and organizations, so can which data quality dimensions are relevant.
If you need help figuring out the data quality dimensions you need, or your data quality project isn’t going as smoothly as you hoped, contact us. We’re experts at untangling a data quality situation: we can help you identify the best data quality dimensions for you and build you a solution to measure them.
1United States Department of Justice, Global Justice Information Sharing Initiative, Information Quality Program Guide, January 2010.
2United States Bureau of Labor Statistics, Developing a Data Quality Profile for the Consumer Expenditure Survey (presentation), Yezzi Angi Lee et al., 1 August 2017.
3United States Department of the Interior, Data Quality Management Guide v1.0, August 2008
4ABS Data Quality Manual Part A v1.0, Australian Bureau of Statistics, 1 April 2016.
5Victoria State Government, Data Quality Guideline: Information Management Framework v1.0. March 2018.
6https://www.statcan.gc.ca/eng/wtc/data-literacy/catalogue/892000062020001, https://www.canada.ca/en/privy-council/corporate/clerk/publications/data-strategy.html
7https://www.canada.ca/en/environment-climate-change/services/national-pollutant-release-inventory/data-quality.html
8Wand, Yair, and Wang, Richard. “Anchoring Data Quality Dimensions in Ontological Foundations”. Communications of the ACM, June 1994. http://web.mit.edu/tdqm/www/papers/94/94-03.html
9Pipino, Leo L., Lee, Yang W., Yang, Richard Y. “Data Quality Assessment”. Communications of the ACM, April 2002. https://www.researchgate.net/publication/2881159_Data_Quality_Assessment
10Jayawardene, Vimukthi, Sadiq, Shazia, and Indulska, Martina. “An Analysis of Data Quality Dimensions”. ITEE Technical Report. 2013/2015. https://espace.library.uq.edu.au/view/UQ:312314
11Black, Andrew and van Nederpelt, Peter. “Dimensions of Data Quality (DDQ) Research Paper.” DAMA NL Foundation, 3 September 2020.
12Note that many sources define Timeliness in a different way: as a measure of how quickly the data exists in the system after it comes into existence in reality. This is a great illustration of dimension’s marketing benefits: one word is concealing a whole lot of nuance.